
What is a Category Management Dashboard

Category Management Dashboard
Power BI
What is a Category Management Dashboard
A Category Management Dashboard, is a data-driven management information process, that supports Category Management and provides real time sourcing information on the number suppliers, spend in period, type of spend and spend purchasing patterns. Dashboards that inform the category manager by monitoring spend, assessing performance and taking corrective sourcing actions to deliver business commitments.
Category Management Dashboards, provide real time information, help shape policy and strategy, provide progress on strategic and tactical sourcing decisions. At its core category management is the management of spend groups aligned by supplier, types of goods and services, the aim of the category manager is to put in place sourcing contracts and policies that provide the company with vetted, approved or preferred supplier lists.
Supercharge your procurement game! - Reserve a Demo Today
With our assistance, you can maximize your procurement strategies. We provide quick, hassle-free access to valuable data, helping you make informed decisions.
Our solution is all about shaking up how you handle procurement data. It's customized to tackle your unique goals and challenges head-on.
Imagine having a personal procurement assistant that boosts your efficiency using your data. Find hidden gems, spot cost-saving opportunities, and dive into smart procurement moves.
Why wait? Grab a free demo and unlock the full power of your procurement data.

Accelerated Insight
Improve your procurement game
Spend Analytics Dashboard Table of Contents
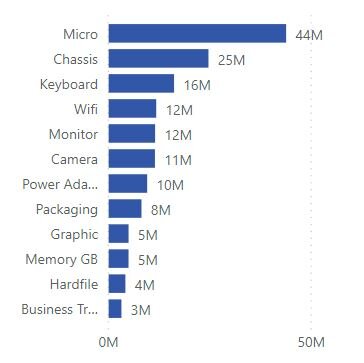
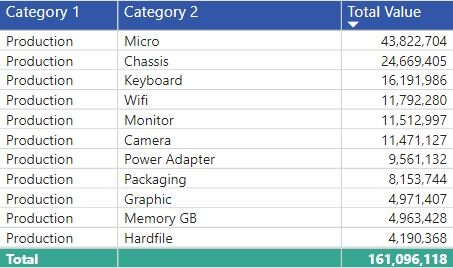
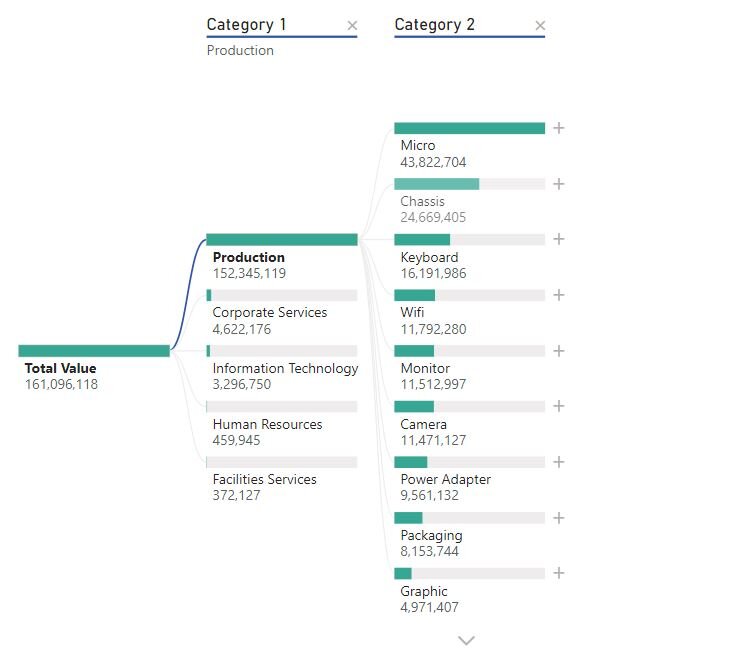
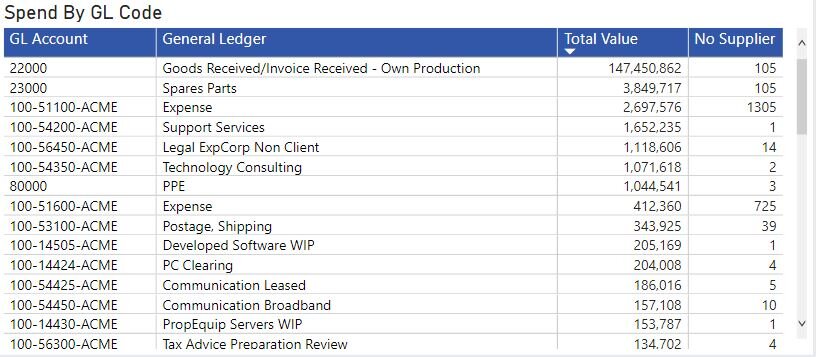
Category Management Dashboards, provide a 360 view for that category, normally focused in two areas, preferred suppliers with agreed contracts in place and the review of maverick or long tail supplier information. To create a functional Category Dashboard for procurement, the following spend analysis process is used.
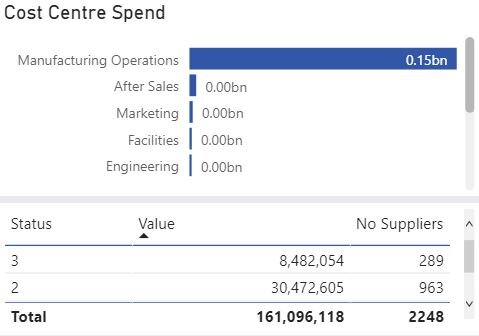
Category Management Dashboards are a management information tool that visually tracks, analyses, and displays Category Level key performance indicator metrics. On the surface the dashboard is a collection of charts, graphs and tables that provide a 360 view of procurement spend, behind the scenes, a full assessment of each data source is conducted, to aid in the creation of supplier analysis, opportunity assessment and sourcing cost savings.
Spend Analysis Solutions need procurement automation software to reduce and minimise data preparation time. Spend analytics software connects with all the procurement data sources, to groups, consolidate, and aggregate into a spend cube analysis tool. Spend analysis dashboards need procurement, finance, and IT departments to work together, to provide the necessary external supplier spend data. Spend data may come from various sources, locations, business entities that include direct spend categories and indirect spend categories.
Direct Spend Categories?
Direct Spend Categories are referred to as the materials, goods and services that make up the cost of goods on the profit and loss statement. Direct Spend Categories vary from industry to industry, sector by sector, essentially these are the items that are used in the end product or service. Direct Spend Categories need automated and relevant analysis that relies upon the creating a data workflow process that is repeatable, flexible, and accurate. Building a reliable Category Management Dashboard needs trusted and validated data.
Example of Indirect Spend Categories are shown in the this link
In many cases, Category Management data, is very complex and difficult to extract from the company’s ERP systems. Accounts payable data is taken from various finance sources and its necessary to have finance calibrate this data, to making sure its correct. Linking spend data, with Supplier purchase order and supplier performance data is key. The period in which the goods or services were purchased is also very important as this helps scope and provide supplier spend analysis reporting with accurate spend analysis reports.
Category Management Consulting companies are used to augment existing category management resources, Spend Analytics Consultants help provide the primary data sources to help build category spend analysis tools.
What is Category Spend Analysis?
Category Spend Analysis aims to provide procurement with insights using historical spend data, that form the basis of strategic and tactical sourcing decisions, protect supply, and deliver value for money. Aligned with company objectives, category spend analysis provides, clarity, spend visibility, and sourcing framework, that aims to create a competitive advantage.
The following link shows when to perform at Category Spend Review and provides the aims of category management principles.
How do Category Management Dashboards work?
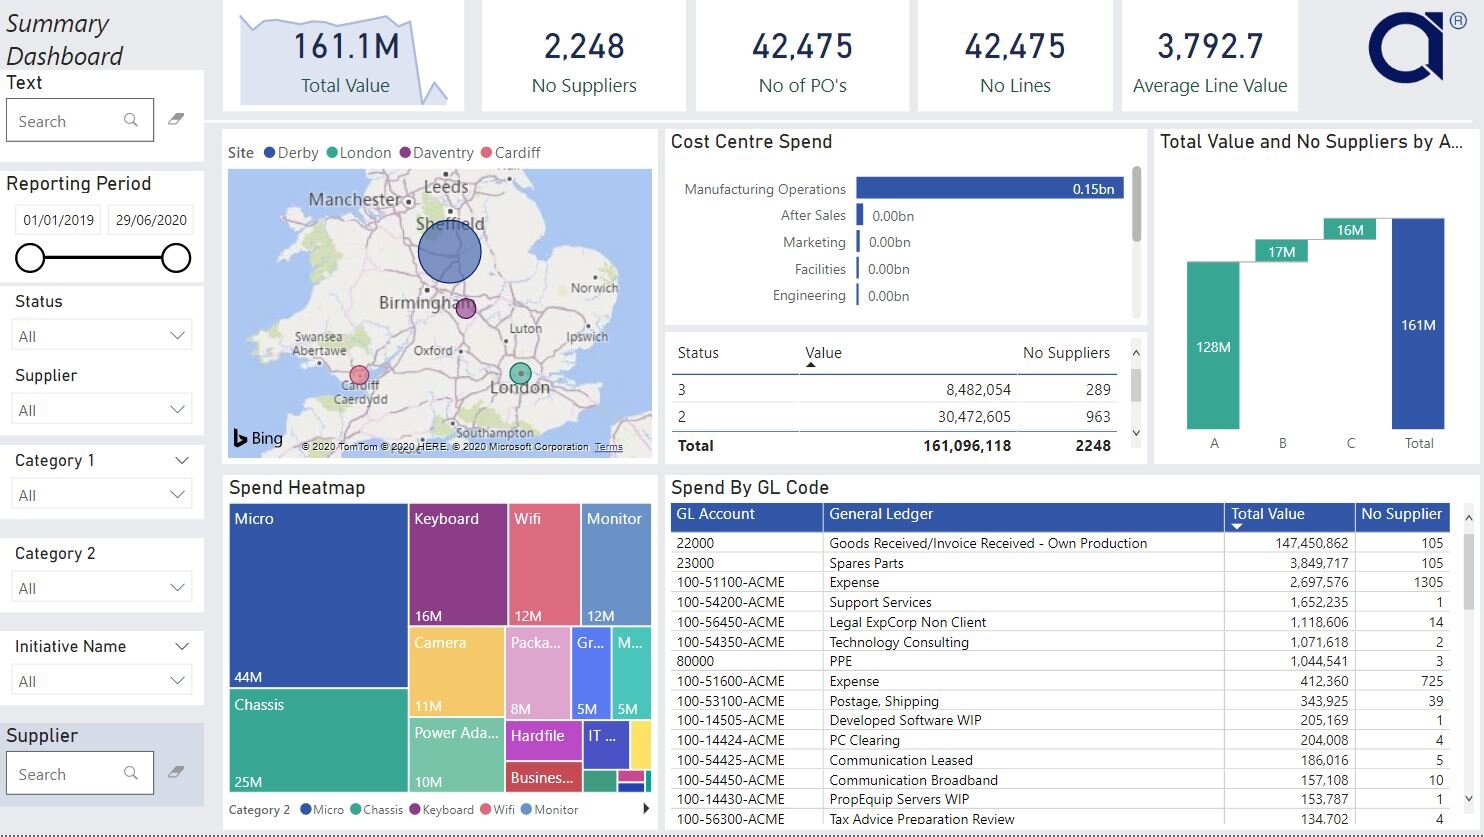
Category Management Dashboards work by providing category managers with spend information, presented in an easy to digest and understand visualisations. Spend Dashboards provide management with powerful insights, that track, monitor and manage the attainment of direct procurement metrics.
Spend Analytics Dashboards is visualization tool, which connect, transform, load, and share procurement spend data.
The Spend Analytics Dashboard is split into the following steps:
Connect to Spend Data
Transform Spend Data
Load Spend Data
Publish Data
Share Data
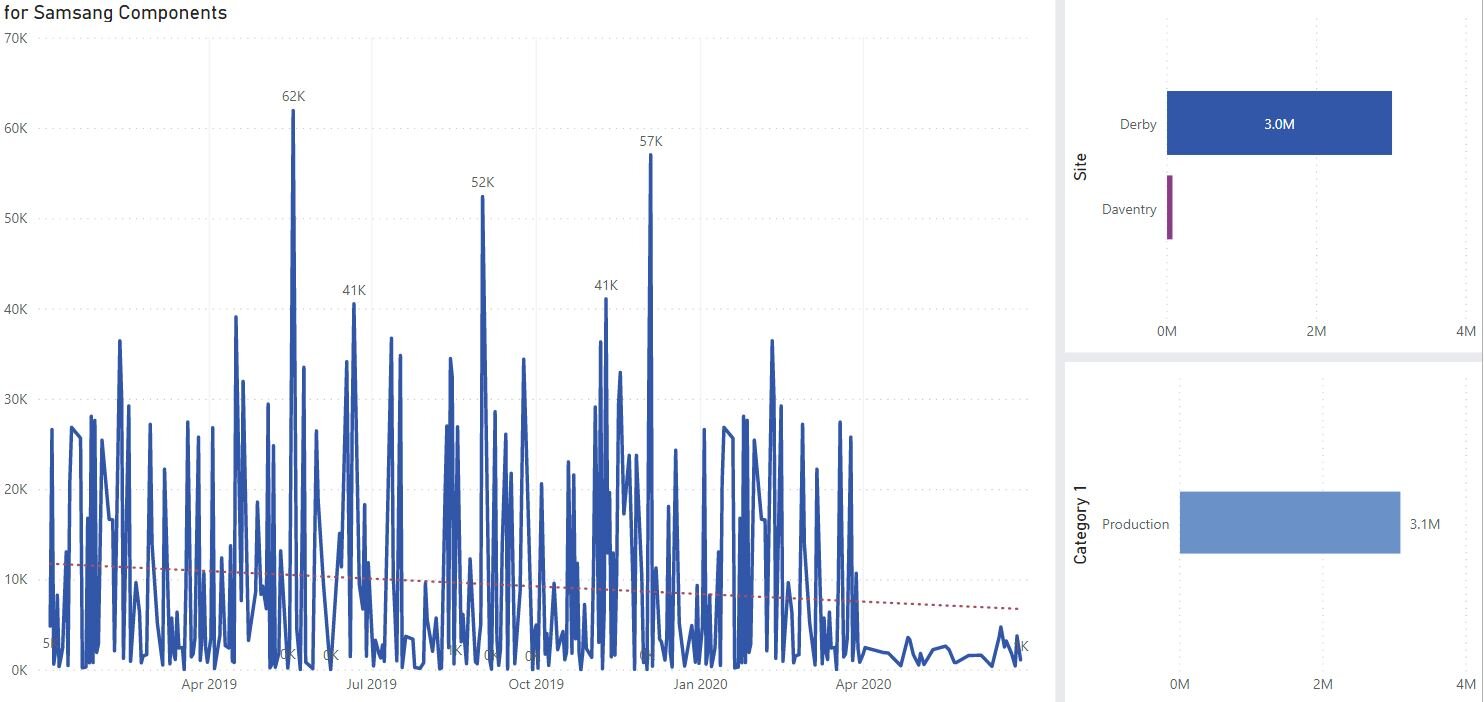
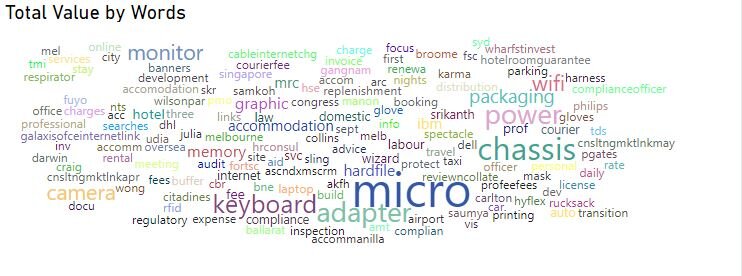
Spend Analysis Dashboards connect and analyse procurement spend data, with built-in text analysis, identify trends, outliers and valuable insights, which help management make informed business decisions. Spend Analytics Dashboard is a data visualization tool that displays the current status of the company spend metrics and (KPIs). The design of a Spend Analysis Dashboard, needs to address each stakeholder group and users understand what KPI’S and metrics are being tracked and why.
Analytics that incorporates procurement spend analysis can be difficult to understand for non-technical users, spend dashboards allow users to participate and understand better the steps taken by compiling data, visualizing trends, and frequency of purchases. The Primary user of any Procurement Spend Analysis platform is executives, senior management, category managers, buyers, and admin staff, it is important to note that each one of these user groups consume Spend Analytics Dashboards differently.
Spend Analytics Dashboards in Power BI
The following video, shows a Spend Analytics Dashboard in Power BI- a Power BI supply chain, spend analysis example dashboard.
Spend Analytics Dashboard - Video YouTube

Category Management Dashboards using Power BI.
What is a Category Management Savings Dashboard?

Procurement Savings Dashboard. Cost Saving Dashboard
Category Management Savings Dashboard
Category Management savings dashboard, is a fact based management information and reporting tool, that lists, tracks and reports procurement cost savings. Procurement departments are typically measured upon in year cost savings and as such form part of cost savings pipeline or a list of projects initiated by procurement that generate desired cost savings between 5% to 15% annually. Cost Savings Dashboards, provide management, with a tracking mechanism for reporting the financial impact or contribution made by procurement to the bottom line. For many procurement leaders, category managers and buyers, their personal business commitments or annual profit related pay is tied to these objectives and as such a fast, reliable process of cost savings reporting is required.
The reporting and tracking of procurement cost savings are generated from the cost savings pipeline or sometimes referred to as the opportunity assessment. This process involves identifying cost saving projects and scoring them by ease of implementation, easy to difficult and placing the cost saving value on the y axis, this provides management with a visual that shows which projects potentially deliver the highest cost savings and which ones are easy to do also known as quick wins.
It is worth noting, that not all cost savings are reported equal or the same, and is dependant upon the financial reporting framework for Opex v Capex . Opex is operating expense and it typically used to form the procurement cost savings baseline, and can be used to track like for like in year savings. Due to the nature of CAPEX procurement, the way projects are funded and amortised will have an impact on reporting and cost savings value, it is advisable to check with your finance department to validate your cost savings for CAPEX.
Cost Savings Dashboard

Category Management Cost Savings Dashboard
The initiator of the cost saving, needs to create a category roadmap and use this opportunity assessment to seek approval from management and finance to proceed with this cost saving initiative, a charter document is created, the scope, baseline value, the business reason for the sourcing action, timescales and cost saving time period, typically over 12 months and has dual reporting in year savings and 12 months. All the supporting data, assumptions and logic are presented normally at a category review board and this has senior management team support, sponsors and stakeholders, that seek evidence based spend analysis, before it is loaded into a live cost savings dashboard.
This process is iterative and may involve a few attempts for sign off, normally focused on baseline, scope and addressable spend, when this is approved it can move from WIP into live and tracking can begin. Note, due to the nature of tracking, it is key to link the send initiatives to data, to ensure no double counting and make sure all data is capture, accelerated insight gets round this issue by creating a baseline and tracking the initiative over time. The next section will show the key components required for a good Category management dashboard.
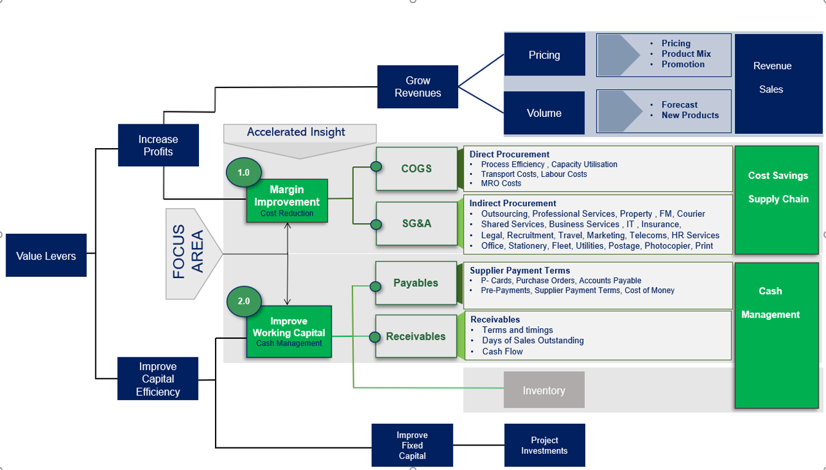
Supply Chain Dashboard : Performance
A Supply Chain Dashboard is part of a management information process, a visual representation of key business analytics, that monitors supply chain performance against KPI’s. A Supply Chain Metrics Dashboard provides management, with insight on Operations performance, cost, efficiency, lead-time, staffing and competitiveness, by using robust data collection using Supply Chain Dashboard. Supply Chain Dashboard Software is used to link vital business analytics data into a a comprehensive management system, that normally is updated and reviewed at least once per day normally at Daily Production or Operational reviews.
Supply Chain Management Dashboard
Supply Chain Management Dashboard (s) normally incorporates the following basic metrics :
Supply Chain Staff Costs
Supply Chain Efficiency Labour
Supply Chain Logistic & Transport Costs
Supply Chain Leadtime
Supply Chain Cost Per Unit
Supply Chain Outsourcing Costs
Supply Chain Fulfilment Performance
Supply Chain On Time Delivery
Supply Chain New Products
Supply Chain Quality
Supply Chain Supplier Performance Dashboard
Supply Chain Dashboard (s) provide a vital step in understanding complex and dynamic supply chains, providing measurement and automated dashboards, that allow key decisions to be made.
What is Accelerated Insight ?
Accelerated Insight is a spend analytics software, that takes raw spend data, organises quickly it into a Spend Analytics Dashboard. Agile process design which requires minimal input from Procurement, designed to take Data to Dashboard in Minutes*.
Providing cost effective remote or onsite Spend Analytics Consulting, that delivers rapid insight and spend visibility, for more information click the link below. A budget friendly spend analytics software and solution, that combines data science, business intelligence with procurement subject matter expertise. Built with purpose, to provide a future proofed, robust, Spend Analytics Software Solution.
Spend analysis Dashboard takes Spend data and creates a method for users to consume it, easily and quickly. Data Visualisation is essential creating insightful, data-driven cost optimization.
The output of which provides procurement with Spend Opportunity Assessment.
▶ YouTube
▶ Pinterest

Category Management Dashboards