
Chart of Accounts : Spend Analysis

Chart of Accounts
Spend Analysis
What are Chart of Accounts?
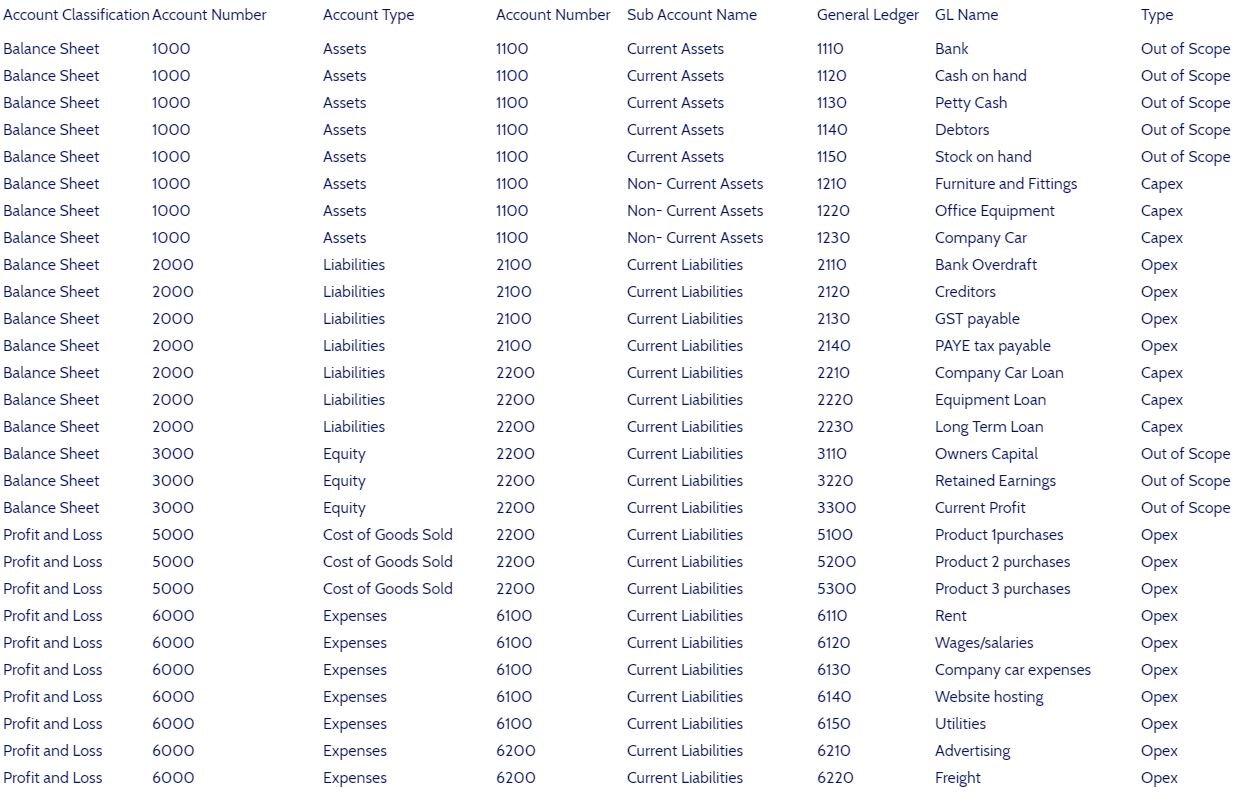
Chart of Accounts are an indexed document or guide, see (table.1), normally held by finance. The Chart of Accounts provide a table of General Ledger codes that all the company transactions are mapped to, they provide procurement with a map of the internal financial reporting structure, that supports spend analysis. To achieve this bespoke Spend Analytics Software is used.
For Spend Analysis Chart of Accounts - data is taken for external Accounts Payable.
Why are chart of accounts important for Spend Analysis ?
Chart of Accounts (COA) - is the foundation to extract spend data from the ERP systems. The reason this is important, is because they help define the scope and the addressable spend. More importantly, they help determine budget and stakeholder information, which is essential at the cost reduction approval stage.
The more accurate and structured the Chart of Account, the easier the data preparation for spend analysis will be. Note that within every finance system they are at least 2 Accounts for every transaction. Thus, assigning the correct accounts at the very beginning is key.
In spend analysis, accounts payable data is used from externally sourced procurement spend, with a list of transactional payments or DEBIT’s paid to external suppliers.
A typical chart of accounts is shown Below in table.1..
Chart of Accounts Table.1
Spend Analysis Capex vs Opex
Capital expenditures Capex consists of the funds that companies use to purchase major physical goods or services that the company will use for more than one year. A company might incur CapEx to increase or improve its fixed assets, for example.
Capital expenditures can include:
Plant and equipment purchases
Building expansion and improvements
Hardware purchases, such as computers
Vehicles to transport goods
Fixed assets are treated as noncurrent assets from an accounting standpoint, which means that they will not be consumed in the first year.
In Spend Analysis terms this can effect the reporting of potential cost savings and its payback period.
Key Differences vs. CapEx and OPEX
Funds that fall under capital expenditures are for major purchases that will be used in the future. The life of these purchases extends beyond the current accounting period in which they were purchased. Because these costs can be recovered only over time through depreciation, companies usually prepare a capital expense budget apart from OPEX.
Operating expenses represent the day-to-day expenses necessary to run a business. Because these are short-term costs that are used up in the same accounting period in which they were purchased, it makes sense for them to have a separate budget.
Spend Analysis Considerations COA
The Chart of account also determines which Items are Capex and OPEX, this is an important consideration when it comes to booking the financial cost savings.
Evidence, suggests, the more effort employed at the data preparation stage, yields downstream benefits in data quality, procurement insights, and optimized cost management. An investment of time, that delivers richer cost optimization, improved category management, and more accurate decision support.
What is Accelerated Insight ?
Accelerated Insight is a spend analytics software, that takes raw spend data, organises quickly it into a Spend Analytics Dashboard. Agile process design which requires minimal input from Procurement, designed to take Data to Dashboard in Minutes*.
A budget friendly spend analytics software and solution, that combines data science, business intelligence with procurement subject matter expertise. Built with purpose, to provide a future proofed, robust, Spend Analytics Software Solution.
Spend Analytics Software - Video YouTube
