
What is Business Analytics?
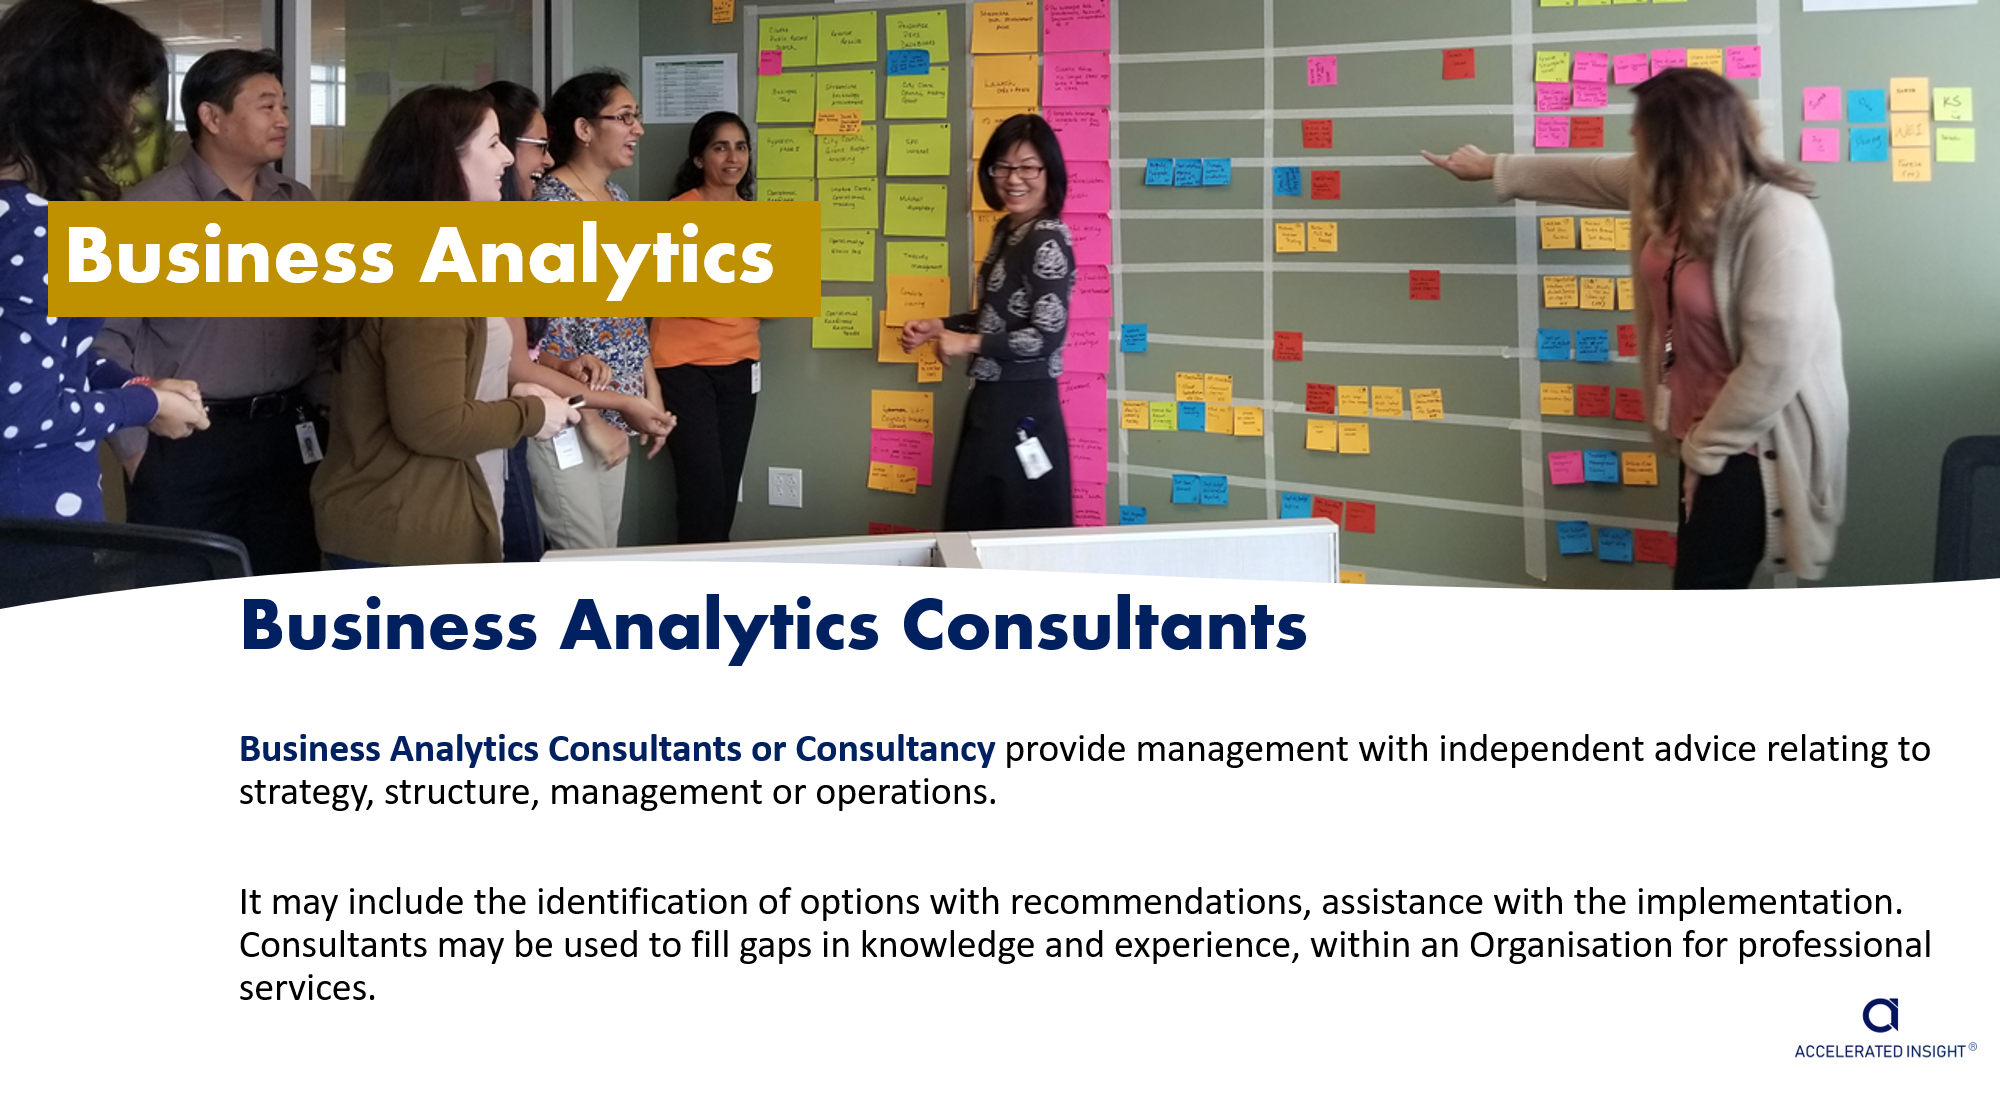
Business Analytics
Business Analytics Technology
What is Business Analytics?
Business Analytics identifies trends, outliers, and valuable insights, which help management make informed business decisions. Business Analytics Dashboard is a data visualization tool that displays Accelerated Insight of the company’s business metrics, KPIs and targets.
Table of Contents
Business Analytics Data Preparation
Business Analytics Objectives
Most Business leaders have a set of KPI’s and business commitments, they need to deliver. Business Analytics provides them with the company wide management system, that monitors, tracks and takes necessary corrective actions.
Business Analytics objectives need to be linked to the overall company objectives; these are normally set out by executives at the beginning of each financial year.
The following list shows the context in which Business leaders are measured and why business analytics is a key element.
Business Objectives:
· Cost Leadership / Market Value
· Cost Management & Shareholder Value
· Value Delivery
· Governance & Compliance
· Operational Efficiency
· Supply Chain Innovation
· Environmental Sourcing
Executives and management teams rely upon real time business analysis, to provide a solid data foundation, that is trusted, accurate, and aligned to company objectives. To build an effective business analytics management system, the following Business Analytics Framework is used.
Business Analytics Framework

Business Analytics Framework listed below:
Data Preparation
Data Preparation analysis, involves extracting, transforming, organizing, verifying, essential data required to build procurement spend analytics reporting. A solid foundation is critical to the success of creating a data-driven spend analysis culture.
Data Extraction
Fact based decision support, that involves
· Data capture
· Data cleansing
· Data aggregation
· Data transformation
· Data sharing
Applied to leverage value, maintain business analytics for operations, and gain competitive advantage.
Data Transformation
Best practice business analysis involves a standard template or data schema, mainly linked to key performance indicator (KPI’s). This reduces the time required to prepare raw data significantly. Business Analytics Consultants are used in conjunction with internal resources to provide fast, accurate data insights.
Business Analytics Dashboards
Business Analytics Dashboards are the most efficient way to track multiple data sources, a business analysis dashboard is a management information tool that visually tracks, analyses, and displays key performance indicator metrics.
On the surface the dashboard is a collection of charts, graphs and tables that provide a 360 view of business operations, behind the scenes, a full assessment of each data source is conducted, to aid in the creation of trust and reliable business data.
The process is split into two stages, data preparation and data visualisation, its purpose is to provide actionable insights, visibility, and compliance. Business Analytics Technology, is used to harness the various data sources.
Business Analytics

Business Analytics
Business Analytics aims to provide management with insights using historical data, that form the basis of strategic and tactical decisions support and deliver value for money. Aligned with company objectives, business analysis provides, clarity, visibility, and sourcing framework, that aims to create a competitive advantage.
Analytical Software Packages, that are aligned to company structure, objectives and linked to company wide data sources, using the following
Data Analysis Steps as a guide :
Data Analysis Steps
Spend Analytics Software typically is uses the following Spend Analytics Tools and Data Analysis Steps
Business Analytics Data Preparation & Extraction Software
Business Analytics Software Data Sources
Business Intelligence Software
Business Analytics Procurement Solutions Software
Business Analytics Optimization Cost Software
Preparation Business Analytics

Data Preparation
Data Preparation is the process of transforming raw data into tangible insights, the process at times can be technically, very challenging and time consuming, it relies upon the creating a data workflow process that is repeatable, flexible, and accurate. Building a reliable business Analysis process needs trusted and validated data. Best in class sustainable spend analysis platforms and spend analysis solutions have automated data collection and validation at its core.
Business Analytics Data Sources

Spend Analytics Software Data Sources
Business Analytics Data can be very complex and difficult to extract from company systems.
Typically, our team would provide a Business Analytics Consultant to work along side your team to prepare the relevant Spend Analytics data sources the follow list shows typical, business analytics data source examples:
ERP Software Example
SAP
Oracle
Microsoft Dynamics
Infor
Contract Software
Contract Management Software
Accounts Payable Software
Procure to Pay Software
P2P Software
Purchase Order Tracking Software
Accounting Spend Analytics Software
Including Budget and Expense Software
Chart of Accounts
General Ledger
P-Card Software
Company Purchasing Credit Card
Bill of Material
Spend Analytics Software linked to ERP and BOM Structures
HR Systems
CRM Marketing Data
Industry Reports
Environmental Reports
3rd Party Data Services
Businesss Analytics : Business Intelligence
Business Analytics Business Intelligence
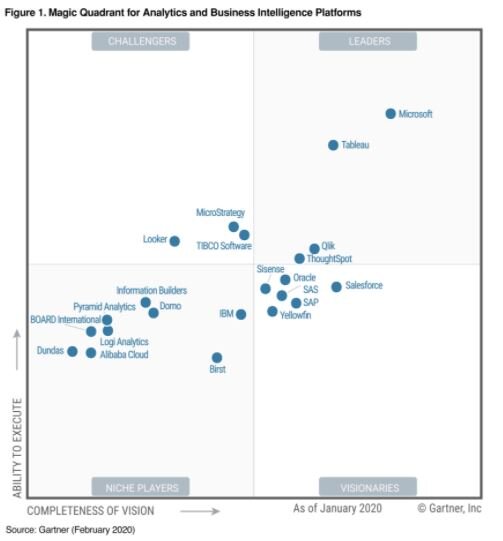
Gartner BI Magic Quadrant
Within Spend Analytics Software a key consideration, is the Business Intelligence BI tool used to visualise the Spend Data.
According to Gartner in a report published in 2020, Augmented capabilities are becoming key differentiators for analytics and BI platforms, at a time when cloud ecosystems are also influencing selection decisions.
This Magic Quadrant will help data and analytics leaders evolve their analytics and BI technology portfolios in light of these changes.
Cloud-based business intelligence (BI) solution that deliver the following Benefits :
Streamline reporting with custom dashboards.
Aggregate data to tell a cohesive story.
Analyse data and deliver actionable information.
Use real-time data to improve collaboration.
Connect to your data anywhere.
The following section shows two main leaders in this space
Power BI source (Microsoft)
End-to-end data protection
Better protect your data across Power BI reports, dashboards, and data sets with persistent protection that keeps working even when shared outside your organization or exported to other formats such as Excel, PowerPoint, and PDF.
Better together
When you use Power BI with Azure and Office, you extract maximum value from your technology and your data. Because Power BI interoperates with the Microsoft technology you already trust, you can use all your data productively.
Extensive data connectors
With a growing library of 120+ free connectors, everyone gets a complete picture for data-driven decision making. Connect directly to hundreds of on-premises and cloud data sources such as Dynamics 365, Azure SQL Database, Salesforce, Excel, and SharePoint.
Prepare, clean and format your data to make the analysis even easier.
What is Accelerated Insight ?
Accelerated Insight is a spend analytics software, that takes raw spend data, organises quickly it into a Spend Analytics Dashboard. Agile process design which requires minimal input from Procurement, designed to take Data to Dashboard in Minutes*.
A budget friendly spend analytics software and solution, that combines data science, business intelligence with procurement subject matter expertise. Built with purpose, to provide a future proofed, robust, Spend Analytics Software Solution.

Spend Analytics Technology